Addition plots
What is an addition plot?
Addition plots are demonstration plots in farmers' fields. In this technique farmers change one factor compared to his or her usual practice to identify the potential of the new technique. Treatments include:
- a new planting density
- a new variety
- additional amounts of a specific fertilizer nutrient.
For example, a potassium (K) addition plot receives more fertilizer K compared to the usual practice. This demonstrates the effect of additional K on yield, grain quality, lodging resistance and/or pest incidence.
When to use an addition plot?
Addition plots should be used if a treatment is expected to perform better than the farmer's usual practice. Both farmers and researchers can use this technique for field demonstrations.
How to establish an addition plot?
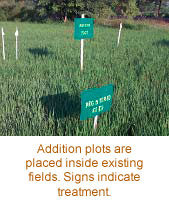
You can install an addition plot as a small (5 m x 5 m) plot inside a field. Treat the whole field as usual (farmer’s practice), but apply the additional treatment to the addition plot.
How to use the addition plot technique?
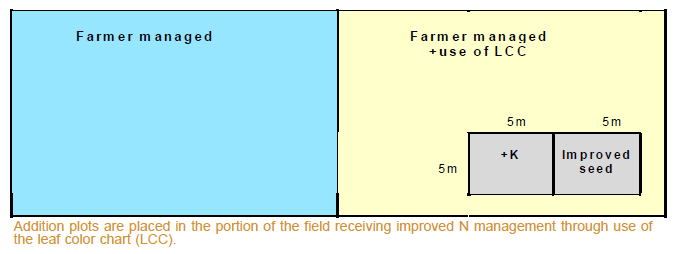
 The addition plot technique helps farmers overcome major agricultural constraints in the field. The technique is sometimes used when evaluating a promising innovation, such as a leaf color chart (LCC) for nitrogen (N) management (see figure below). In this example:
- A farmer's field is split in two. The farmer manages one half as usual. The other half is managed in exactly the same way except the farmer uses the LCC.
- Addition plots to demonstrate the benefits of other innovations (such as K fertilizer, improved seed, a new variety or alternative crop management) are placed within the LCC half of the field.
See IRRI's Leaf Color Chart fact sheet for more information about using the LCC.
What are the limitations of addition plots?
- If the addition plot is in a part of the field that has different characteristics to the rest of the field, your conclusions may be incorrect.
- Don't use addition plots in a time-consuming trial-and-error approach to develop fertilizer phosphorus (P) and K recommendations. Addition plots should only be used as demonstration plots when you expect benefits from additional fertilizer (compared to farmers' usual practice).
Note: Recommendations for P and K rates can be developed using the omission plot technique (see IRRI's Nutrient Omission Plots fact sheet for more information).